
Overall Equipment Effectiveness (OEE) is a key metric used to assess equipment and process efficiency, and AI-powered vision systems can automate much of the manual data entry required for OEE.
By visually monitoring machines and production lines, these systems can detect machine states (running, idle, down), count parts (both good and defective), and even calculate cycle times directly from video footage. This significantly reduces the need for human input, increasing data accuracy and freeing up operators for more value-added tasks.
Investing in AI-powered OEE initiatives drives significant value and return on investment (ROI), leading to cost savings, waste reduction, and improved competitiveness in the market.
Maximizing Manufacturing Efficiency with OEE and AI
In the manufacturing industry, optimizing operational efficiency is crucial for competitiveness and profitability. One of the most important metrics used for this purpose is Overall Equipment Effectiveness (OEE). OEE has been around as a concept for decades, but historically relied on manual inputs and estimates. Now for the first time, artificial intelligence (AI) can revolutionize the understanding and utilization of OEE in this sector, making it a practical metric to track.
What is Overall Equipment Effectiveness (OEE)?
What is OEE? OEE is a key performance indicator (KPI) used to assess the efficiency of manufacturing equipment and processes. It provides insights into how well equipment is utilized, how productive it is during scheduled production time, and how effectively it performs when running. OEE is calculated based on: Availability, Performance, and Quality.
The formula for OEE is:
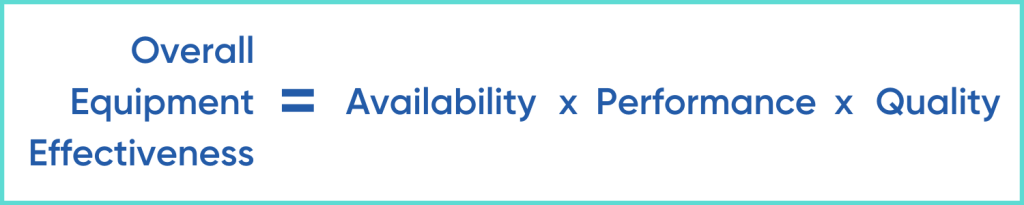
OEE Definitions
Availability: This measures the percentage of time that equipment is available for production, accounting for factors like downtime for maintenance and unplanned stoppages.
Performance: Performance indicates the speed at which equipment operates compared to its maximum potential speed, considering factors like equipment running at reduced speed and minor stoppages.
Quality: Quality measures the percentage of good-quality products manufactured compared to the total number of products produced, accounting for defects, rework, and scrap.
For example, if your equipment is available 24x7x365, running at maximum capacity, and never produces a defect, you would calculate this as:
100% Availability * 100% Performance * 100% Quality = 100% OEE
Even the best equipment will sometimes need maintenance, so this is an unrealistic example, but it helps you understand the concept.
What is a good OEE score?
Today, there seems to be a consensus that an OEE score of 85% is “world-class”. This number may increase as more manufacturers move towards “lights out” or “closed-loop” systems.
To put an 85% OEE in perspective, if your equipment is available 95% of the time, running at 90% of capacity, and producing high-quality results 99% of the time, you would calculate your OEE as follows:
95% Availability * 90% Performance * 99% Quality = 84.6% OEE
While you can round that up to 85% OEE, it technically isn’t world-class. Sources vary on other OEE score benchmarks. Some claim the average OEE is 60%, while others believe it ranges between 65-85%. In reality, it varies depending on your specific sub-industry. What matters most is that you accurately measure your own OEE and create actionable strategies to improve it.
How AI Enhances Understanding of OEE in Manufacturing
The concept of OEE is not new, but measuring it accurately has always been challenging. Historically, OEE calculations relied on workers manually measuring, reporting, and entering data. Accuracy and consistency depend on who is measuring, reporting, and entering data at any given time.
AI eliminates the variables and ensures that all data considered is accurate and trustworthy. This consistency allows the AI to create more accurate measures of efficiency and more useful recommendations on improving OEE over time. Vision AI, along with today’s soft sensor technologies, can gather precise information on uptime, performance, and defect rates. Vision AI systems use machine learning algorithms to inspect products in real time, identifying defects more accurately than humans and reducing the number of false positives. By integrating Vision AI into production lines, manufacturers can ensure consistent product quality, minimize defects, and boost OEE.
Key Challenges of Manual OEE Measurements
Multiple, essential manual data entry points are needed to calculate OEE on a single process. Manual tracking, data entry, and calculations become exponentially more challenging to complete for complex manufacturing with multiple processes to measure, and the risks of inaccurate data increase.
Here are some of the variables that must be tracked for each process:
Time-Based Data
It’s vital to track downtime reasons separately for more in-depth analysis (e.g., breakdown vs. changeover).
Planned Production Time: The total scheduled time the process is expected to operate during a shift or specific period.
Run Time: The actual time the process was actively producing parts. This excludes planned breaks, maintenance, etc.
Downtime: Any period where the process was not running due to:
Breakdowns: Equipment failures or malfunctions
Changeovers: Time spent switching from one product to another
Setups: Time for initial adjustments and calibration
Minor Stoppages: Brief interruptions in production
Reduced Speed: Instances of the process running slower than ideal
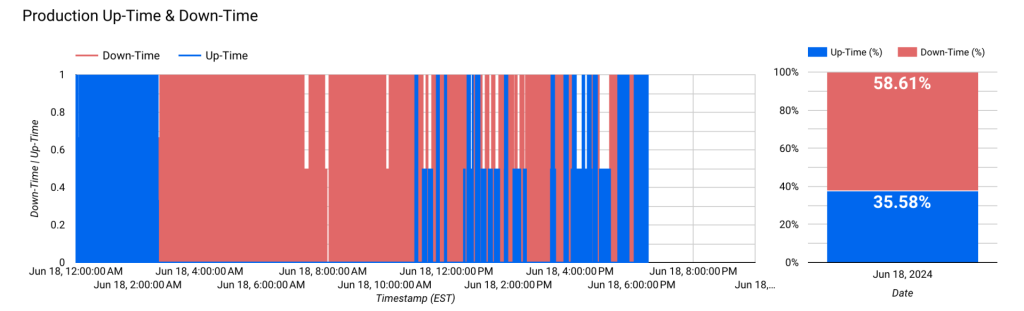
Uptime vs. downtime of an overflow line in plastics molding facility
Count-Based Data
Total Count: The total number of parts produced during the period analyzed.
Good Count: The number of parts meeting all quality specifications.
Defect Count: The number of parts with defects or requiring rework.
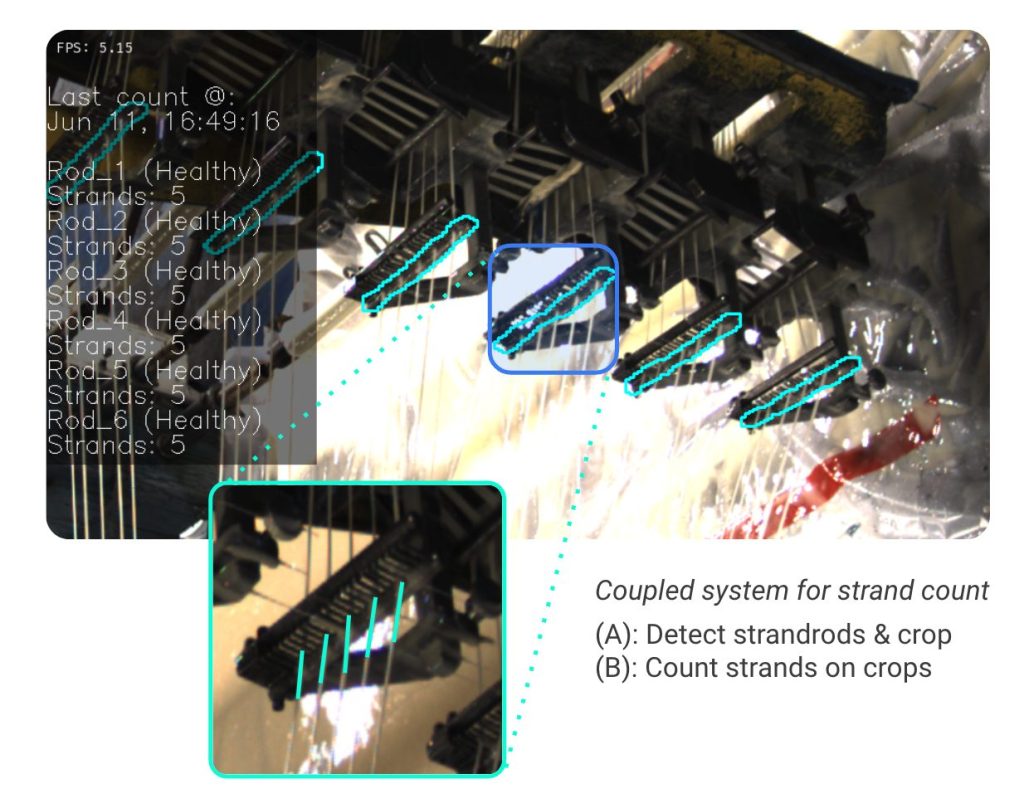
Vision AI detects and counts rods & strand while assessing quality for OEE calculation inputs
Other Important Data
Ideal Cycle Time: The theoretical fastest time the process can produce a single good part without defects.
Even with manual OEE data collection, using a spreadsheet or a simple OEE calculation tool will be much more efficient and less prone to error than doing calculations by hand.
Value of OEE with AI in Manufacturing
Investing in OEE improvement initiatives powered by AI can yield significant value and return on investment (ROI) for manufacturers. Because of the number of variables, it is hard to create definitive ROI in a blog post, it is best to speak with an expert to get a tailored estimate. Some of those variables include:
- Increased Equipment Availability: Predictive maintenance powered by AI reduces unplanned downtime, ensuring optimal utilization of manufacturing equipment.
- Improved Production Efficiency: AI-driven performance analysis identifies and eliminates bottlenecks, optimizing production processes and enhancing equipment performance, leading to improved efficiency.
- Enhanced Product Quality and Compliance: Vision AI-based quality inspection ensures consistent product quality, reducing defects, rework, and scrap. This not only improves customer satisfaction but also helps manufacturers comply with quality standards and regulations.
- Cost Savings and Waste Reduction: Minimizing downtime, improving efficiency, and reducing defects result in substantial cost savings and waste reduction, directly impacting the bottom line.
- Competitive Advantage: Manufacturers that effectively utilize AI to optimize OEE gain a competitive edge by being more agile, efficient, and responsive to market demands.
Example ROI:
A line that produces 60 units per minute for 18 hours a day, 7 days per week. Margins per unit are $1.00. Starting OEE is 40%. After measuring and understanding areas for improvement, OEE is increased to 45%, resulting in over $1.3M in additional value.
OEE is a critical metric for measuring and improving operational efficiency in the manufacturing industry. While it was introduced as a concept over 30 years ago, it is poised to take on even more prominence thanks to advancements in AI and precision tracking. Now, manufacturers can increase their trust in OEE and unlock new opportunities for optimization.
By investing in AI-powered OEE initiatives, manufacturers can significantly improve equipment availability, production efficiency, and product quality, and gain a competitive advantage in their industry. The future of operational excellence in manufacturing lies at the intersection of OEE and AI, presenting endless possibilities for innovation and continuous improvement.
Calculate the incremental value of OEE improvements